

Abstract
Background: Resistance to apoptosis is one of the hallmarks in hematological neoplasms, most typically via dysregulation of the intrinsic mitochondrial pathway. The most important antiapoptotic/pro-survival proteins in this pathway are BCL2, BCL2L1 and MCL1. Molecules targeting each of these proteins are in various stages of preclinical and clinical development. The BCL2 inhibitor venetoclax is the first FDA approved drug in this setting and was shown to be highly effective in CLL and some B-cell lymphoma subtypes. Kumar et al. (Blood 2017) reported that in multiple myeloma response to venetoclax correlated with higher BCL2, BCL2:BCL2L1 and BCL2:MCL1 mRNA expression ratios.
Aim: To determine the gene expression levels of BCL2, BCL2L1 and MCL1 across various hematological neoplasms in order to identify best candidates for pro-survival protein inhibitors.
Patients and Methods: 2239 patients with hematological neoplasms (Table1) were evaluated by whole transcriptome sequencing (WTS) and 64 cases without hematological neoplasms were analysed as controls. Total RNA was sequenced on the NovaSeq 6000 with a median of 50 million reads per sample. The obtained estimated gene counts were normalized and the resulting log2 counts per million (L2CPM) were used as a proxy of gene expression.
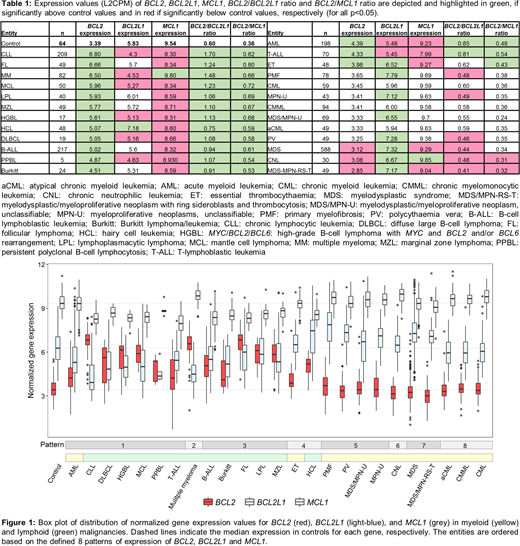
Results: The median BCL2 expression (exp) was significantly higher in lymphoid malignancies (lyM) compared to controls and myeloid malignancies (myM) (L2CPM: 5.8 vs 3.4 vs 3.4, p<0.0001) with the highest exp noticed in CLL, FL and MM (Table 1). On the other hand median BCL2L1 exp was significantly higher in myM and lower in lyM as compared to controls (6.7 vs 5.2 vs 5.8, for both p<0.0001). Median MCL1 exp was comparable to controls in myM, while it was significantly lower in lyM (9.4 vs 9.5 vs 8.5, p<0.0001). Comparing the different entities 8 patterns based on significant differences in exp of BCL2, BCL2L1 and MCL1 compared to controls emerged: 1) increased BCL2, lower BCL2L1, lower MCL1 (CLL, MCL, DLBCL, HGBL, PPBL, T-ALL and AML), 2) increased BCL2, lower BCL2L1, increased MCL1 (MM), 3) increased BCL2, lower MCL1 (B-ALL, Burkitt, FL, LPL, MZL), 4) increased BCL2, increased BCL2L1, lower MCL1 (ET, HCL), 5) increased BCL2L1 (MDS/MPN-U, MPN-U, PMF, PV), 6) lower BCL2, increased BCL2L1, increased MCL1 (CNL), 7) lower BCL2, increased BCL2L1, lower MCL1 (MDS, MDS/MPN RS-T), 8) no significant changes compared to controls in the expression of any of these genes (aCML, CML, CMML). Entities with pattern 1 are most likely to respond, followed by those with patterns 2, 3 and 4. Within most entities the BCL2 exp varied only within small ranges (Figure1).
AML was the only myM with a significantly increased median BCL2 exp. In more detail, 21% of AML patients showed BCL2 exp above control values. The mean BCL2 exp was significantly higher in the following subgroups: PML-RARA rearranged (rear) (5.5, p<0.001), KMT2A rear (5.0, p=0.009), IDH1 mutated (mut) (5.1, p=0.025), and GATA2mut (4.9, p=0.04), while it was significantly lower in the following subgroups: DNMT3Amut (4.2; p=0.049), SF3B1mut (3.59; p=0.03), TET2mut (4.1, p=0.016), RAD21mut (3.7, p=0.05), RUNX1-RUNX1T1 rear (3.6, p<0.001), and complex karyotype (3.8, p=0.003). In B-ALL BCL2 exp was found to be higher in ALL with KMT2A rear, high hyperdiploidy and low hypodiploidy while it was lower in BCR-ABL1+ ALL. In T-ALL no association between BCL2 exp and phenotype or genotype was observed.
In MDS BCL2 exp was lower compared to controls (3.1 vs 3.4, p=0.004), while BCL2L1 exp was higher (7.3 vs 5.8, p<0.0001). The BCL2 exp was lowest in the very low cytogenetic risk group according to IPSS-R, increased with risk category and was highest in the very poor cytogenetic risk group (2.9, 3.1, 3.1, 3.7, 3.9). SF3B1mut and TET2mut were associated with a significantly lower BCL2 exp as compared to the respective unmutated group (2.7 vs 3.3; 2.9 vs 3.2; for both p<0.0001).
Conclusions: 1) The pattern of BCL2, BCL2L1 and MCL1 expression differs significantly between entities. 2) More than 85% of patients with CLL, FL and MM show an increased BCL2 expression, while in myeloid malignancies BCL2 expression is low and only 21% of AML patients demonstrate an increased BCL2 expression. 3) Prospective studies are mandatory to evaluate the predictive value of BCL2, BCL2L1 and MCL1 expression for response to therapies targeting pro-survival molecules in order to identify patients with the highest likelihood of response.
Haferlach:MLL Munich Leukemia Laboratory: Employment, Equity Ownership. Walter:MLL Munich Leukemia Laboratory: Employment. Höllein:MLL Munich Leukemia Laboratory: Employment. Nadarajah:MLL Munich Leukemia Laboratory: Employment. Kern:MLL Munich Leukemia Laboratory: Employment, Equity Ownership. Meggendorfer:MLL Munich Leukemia Laboratory: Employment. Haferlach:MLL Munich Leukemia Laboratory: Employment, Equity Ownership.

This feature is available to Subscribers Only
Sign In or Create an Account Close Modal